Introduction
Our Google Maps mashup project is based upon EPA Toxic Release Inventory (TRI) data released March 19,2009 and schools in the U.S. Links are provided to RTK Net for detailed chemical pollution release data and Scorecard for chemical information.
Toxic Chemical Pollution Releases and Schools

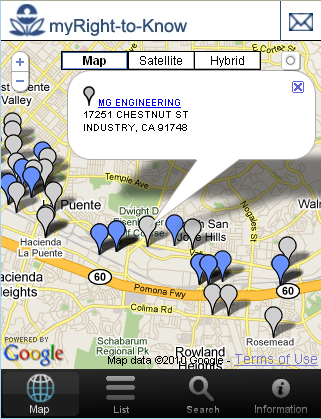
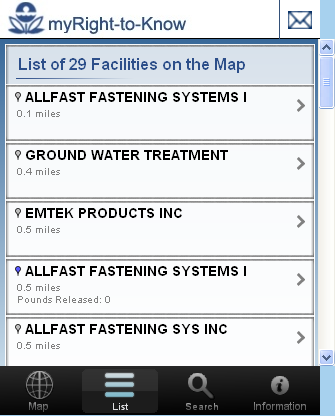
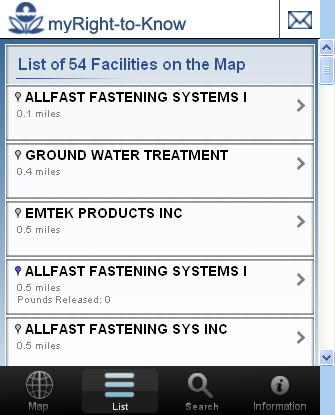
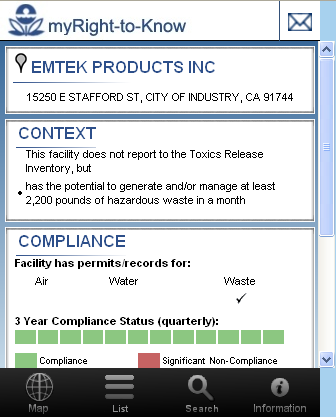
As you zoom in you will see a change in the icons of the facilities near the center of the map - these are the ones that you can click on and find the facility name, number of schools within 1 mile and number of schools within 5 miles of the facility plus a link to a database about the toxic history of the facility. You can also click on a chemical to learn more about associated risks. The schools will appear as you zoom in. As you zoom in further, you will see the school icon change - at that point you can click on the school to view its name.
Using the Maps
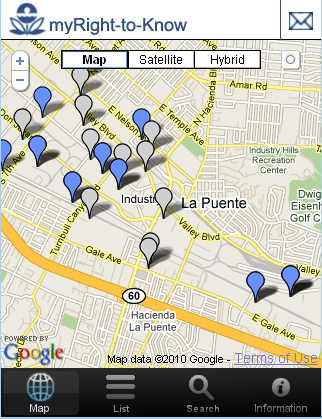
Zoom in or enter some search criteria to begin your discovery of toxic chemical risks near your schools and in your community. Note that a search brings you to a fairly zoomed in map. You may wish to zoom out a bit to see what toxics might be in the surrounding region.
For 2007, 21,996 facilities, including federal facilities, reported to the TRI Program. They reported 4.1 billion pounds of on-site and off-site disposal or other releases of the almost 650 toxic chemicals. Click here for more about EPA's Toxic Release Inventory.
Very Short History of the Toxic Release Inventory (TRI)
The Bhopal disaster or Bhopal gas tragedy was an industrial disaster that took place at a Union Carbide subsidiary pesticide plant in the city of Bhopal, India. On 3 December 1984, the plant released 42 tons of toxic methyl isocyanate (MIC) gas, exposing more than 500,000 people to toxic gases. The first official immediate death toll was 2,259. A more probable figure is that 8,000 died within two weeks, and it is estimated that an additional 8,000 have since died from gas-related diseases.
The short story is that the U.S. responded to this disaster by introducing the Toxic Release Inventory (TRI) in 1987. While the TRI does not cover all of the toxic risks we face in our neighborhoods, it is a good place to start to build a community toxic inventory. See below for the other data that will soon be added to the maps allowing you to build a more comprehensive community toxic inventory.
Shapefile Downloads
To enable you to create your own community toxics inventory, we have prepared Toxic Release Inventory GIS shapefiles for you to download. These come packaged with base layers like state boundaries, waterways, roads, etc. You don't have to be a GIS professional to use these. They also come packaged with instructions for using these with our free Lear2Map GIS Tutorial and Atlas.
TRI with Google Earth
We have also prepared Google Earth maps based on the TRI data.
Missing Data
Unfortunately, after all these years and with the availability of GPS technology, there are still hundreds of facilities that report no latitude or longitude. We have prepared Excel spreadsheets for you to download so that you can see the facilities that are not on the maps at present. If you have information about the location of facilities that are missing or mis-located, please email me. With your help, we'll make the data more accurate for everyone.
Community Toxic Risk Maps
Currently we have two projects at ToxicRisk.com. The first is map-based using the latest Toxic Release Inventory (TRI) data released March 19, 2009. The second is a searchable database of EPA Risk Management Plans (RMP) submitted to EPA in 1999. In the near future we will be adding this data to the maps as well as the more recent 2004 RMP submissions. For more about the Risk Management Plan, visit EPA's Risk Management Plan website.
More Coming in our Community Toxic Risk Mapping Series
In the near future we'll be adding the following to our database and maps. Be sure to also check out our Google Earth Maps of the recenlty released Toxic Release Inventory data. Note that all of our data is obtained from publicly available websites provided by RTK Net and the U.S. EPA:
Risk Management Plans (RMP)
The RMP includes an accident history, chemicals stored on-site, emergency response plans and much more. This data is much more useful but is not nearly as available to the public as the TRI. In fact, the most important portion - the worst case scenarios in case of an accidental release - were never distributed widely. Check our resources for more about this. We have provided a data search of the RMP that is based on the 1999 submissions - the first round of reports. In the near future we will be adding this data plus the latest (2004) submission to the toxic risk maps.
Water Pollution (PCS)
The EPA PCS is a national computerized management information system that automates entry, updating, and retrieval of National Pollutant Discharge Elimination System (NPDES) data and tracks permit issuance, permit limits and monitoring data, and other data pertaining to facilities regulated under NPDES. The NPDES permit program regulates direct discharges from municipal and industrial wastewater treatment facilities that discharge into the navigable waters of the United States. Wastewater treatment facilities (also called "point sources") are issued NPDES permits regulating their discharge. Reports for those facilities identified by EPA as "Major" include the names and amounts of chemicals and other substances that are discharged.
Superfund Sites NPL
Information on Superfund sites was obtained from the Comprehensive Environmental Response, Compensation and Liability Information System (CERCLIS), which is the official repository for site and non-site specific Superfund data in support of the Comprehensive Environmental Response, Compensation, and Liability Act (CERCLA, or Superfund). Sites are placed on the National Priorities List (NPL) by EPA if they have uncontrolled releases of hazardous substances that are priorities for long-term remediation and response.
Superfund Sites "No Further Action"
There are approximately 24,000 sites that have been included in CERCLIS in the past, but for which EPA requires no further action under the Federal Superfund program.
Superfund Sites NOT on NPL
These are Superfund sites where there is ongoing Federal interest or potential Federal activity, but where the hazard posed is not sufficiently significant or time-critical for the site to be placed on the NPL.
Toxic Release Inventory (TRI)
The TRI System (TRIS) contains data submitted to EPA by regulated facilities concerning chemicals and chemical categories listed by the Agency under Section 313 of the Emergency Planning and Community Right-to-Know Act. Data contained in the system include chemicals present, amount of on-site use, releases and off-site transfers (including Publicly-Owned Treatment Works, POTWs), on-site treatment, and minimization/prevention actions. TRIS contains information about releases and transfers of more than 600 toxic chemicals and compounds to the environment. We have included data for TRI facilities that reported their 1997 releases and transfers. Further data and information about the facility and chemicals released and transferred are provided through links to RTK Net.
Hazardous Waste Facilities
Information contained in the Hazardous Waste information is taken from the EPA Biennial Reporting System (BRS). It contains information on facilities that treat, store, or dispose (TSD) of RCRA hazardous wastes or are classified as Large Quantity Generators (LQGs) under RCRA. A RCRA hazardous waste is a waste that is both (a) described by one or more federal RCRA waste codes, and (b) is not exempted from RCRA regulations. RCRA classifies as LQG a facility that either (a) generated 1,000 kg or more of RCRA hazardous waste in a single month; (b) generated in a single month or accumulated at any time 1 kg of RCRA acute hazardous waste; or (c) generated or accumulated at any time more than 100 kg of spill clean up material contaminated with a RCRA acute hazardous waste. Reports for those facilities identified by EPA as "Waste Managers" list amount and type of disposal.
AIRS Facilities
EPA's Office of Air and Radiation stores information on air quality, point source emissions, and area/mobile source data required by federal regulation from the 50 states in its Aerometric Information Retrieval System (AIRS). States are required by the Code of Federal Regulations (CFR) to report to EPA annual emissions estimates for point sources emitting greater than or equal to 100 tons per year of volatile organic compounds (VOCs), nitrogen dioxide (NO2), sulfur dioxide (SO2), particulate matter less than 10 microns in size (PM-10); 1000 tons per year of carbon monoxide (CO); or 5 tons per year of lead (Pb). The Clean Air Act Amendments also require states to report emissions data for point sources in areas where air pollution exceeds Federal standards (nonattainment areas).
Please note that this website does NOT provide the Offsite Consequence Analysis section of the Risk Management Plans as provided by law. Please see our resources for more about this important issue.
Update: September 16, 2009 A.M. - Zeros Count
Using the raw EPA data, many facility reports show zero releases. RTK Net has a different (and we think, better) approach to this. We will be switching to the RTK Net TRI data. Click here for more about this.
Update: June 28, 2009 P.M. - Chemicals linked to Scorecard.org
Each chemical a facility released is now linked to the Scorecard.org website. At Scorecard.org you will be able to find out much more about the chemical released near your schools and in your neighborhoods. Details include such things as: human health hazards, hazard rankings, chemical use profile, ranking of chemicals by reported environmental releases in the United States, regulatory coverage, basic testing to identify chemical hazards, and information still needed for safety assessment.
Update: April 20, 2009 P.M. - Schools Added to Maps
We have added schools to the maps. The maps are now a bit faster and easier to navigate. As you zoom in you will see a change in the icons of the facilities near the center of the map - these are the ones that you can click on and find the facility name, number of schools within 1 mile and number of schools within 5 miles of the facility plus a link to a database about the toxic history of the facility. The schools will appear as you zoom in. As you zoom in further, you will see the school icon change - at that point you can click on the school to view its name.
Note that ToxicRisk.com is based on 2007 TRI data. The 2008 TRI data is now available and, as we find the resources to do so, we hope to update with the new data soon.
Go to ToxicRisk.com Now
Learn More About and Access the 2008 TRI Data Released December 2009