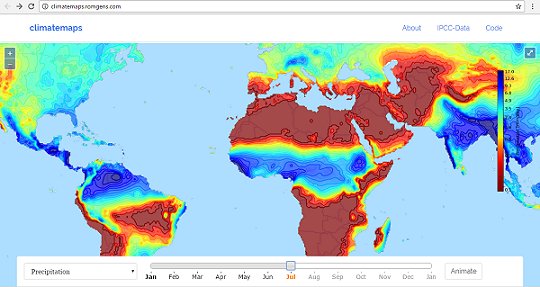
Very nice application by Bart Römgens allowing one to visualize on maps a host of climate related variables. The maps can be animated as well to view changes over time. Visit Climatemaps.
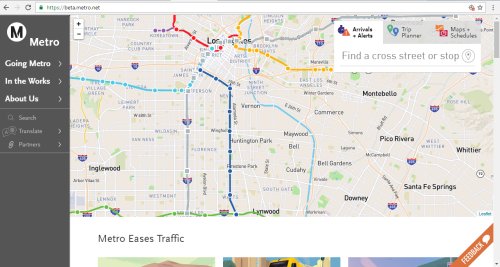
The Los Angeles Metro opened up a new beta version of its website for public review. The map seems extremely useful and does not require a lot of drill-down to get to what you want to find out. Check it out at: beta.metro.net.
For more GIS news, software, shapefile and maps visit MapCruzin.com