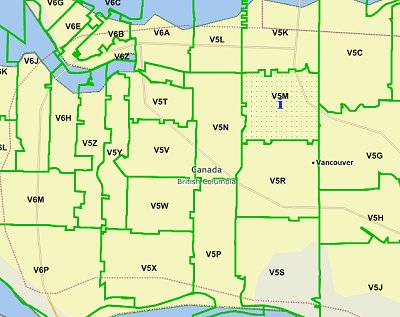
Monday, December 3, 2012

U.S. Geographic Names Information System (GNIS) Shapefiles Based on USGS GNIS Data Updated 10/1/2012

The U.S. Geographic Names Information System (GNIS) was updated October 1, 2012. This point data represents over 2 million name records in the U.S. in the following categories: Airport, Arch, Area, Arroyo, Bar, Bay, Beach, Bench, Bend, Bridge, Building, Canal, Cape, Cemetery, Census, Channel, Church, Civil, Cliff, Crater, Crossing, Dam, Falls, Flat, Forest, Gap, Glacier, Gut, Harbor, Hospital, Island, Isthmus, Lake, Lava, Levee, Locale, Military, Mine, Oilfield, Park, Pillar, Plain, Populated Place, Post Office, Range, Rapids, Reserve, Reservoir, Ridge, School, Sea, Slope, Spring, Stream, Summit, Swamp, Tower, Trail, Tunnel, Valley, Well, Woods,

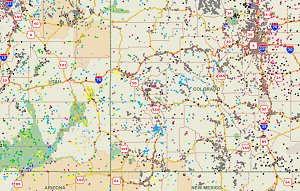
We've created shapefiles from this updated GNIS data and made it available for download.

Download the new GNIS based shapefiles

Mike

Friday, October 26, 2012

Use GIS to Investigate the Potential of Climate Change Driven Hurricane Sandy Frankenstorm to Create a Fukushima-Like Nuclear Disaster in the U.S.

Climate change is responsible for increasing extreme weather. Will the hurricane Sandy superstorm be responsible for a Fukushima-like nuclear disaster in the U.S? A recent leaked report from the NRC says that many nuclear energy power plants are not prepared for severe flooding events.

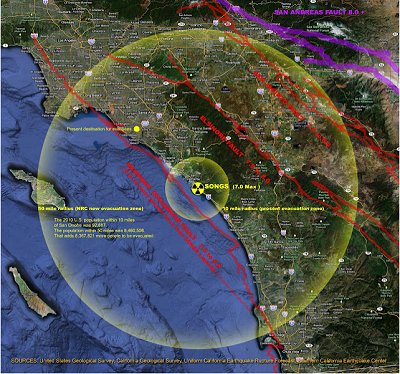
Download the reports and GIS shapefiles and use GIS to investigate the possibilities of global warming driven "frankenstorms" creating Fukushima-like nuclear disasters in the U.S.

Mike

Sunday, September 23, 2012

2011 Toxic Release Inventory TRI Data Download

Hi - August 31, 2012 EPA released the 2011 TRI preliminary data. With this data you can find out more about potential toxic chemical risks where you work, live and play. Learn more and download the 2011 TRI data.

If you have a need for custom GIS shapefiles using this and other data, send me an email.

Thank You,

Mike

Wednesday, September 5, 2012

New Interactive Maps: Mapping the Impacts of Climate Change

Nice interactive map project from the Center for Global Development.

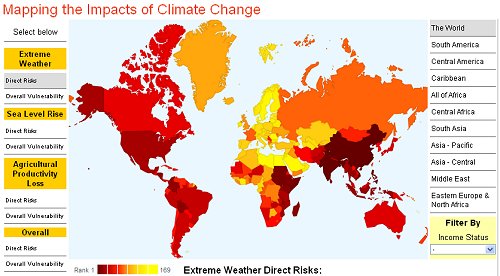
Maps cover extreme weather, impacts on agriculture and sea level rise for 233 countries. You can download the data used for the project.

Learn more about Mapping the Impact of Climate Change and Download the Data

Tuesday, September 4, 2012

Joining Census Data to TIGER/Line 2012 Shapefiles

Hello - It's been an exciting last couple of weeks (well for me anyway). On August 17, 2012 U.S. Census released the TIGER/Line 2012 shapefiles AND more and more data from the latest decennial census is available at American FactFinder. I've written a short article about joining the two data sets (Tiger Shapefiles to AFF census data) with links to more information.

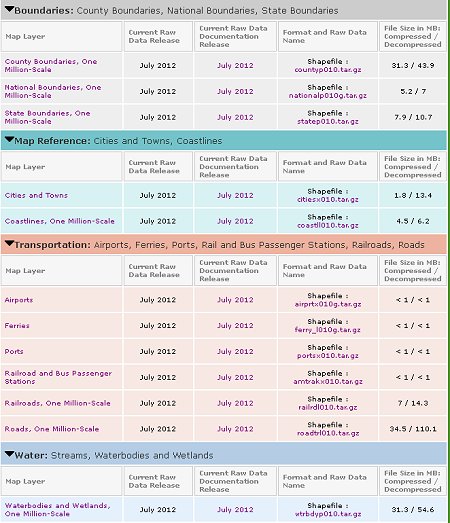
View Joining Census Data from American FactFinder to TIGER/Line 2012 Shapefiles.

Mike

Free Download Tiger/Line Shapefiles with 2010 Population and Housing

Hi - Not sure how long these will be available, but they are now. Census has provided some national level 2010 Tiger shapefiles pre-joined with 2010 census data. Shapefiles include:

  • 111th Congressional Districts
  • Alaska Native Regional Corporations (ANRC)
  • Census Tracts
  • Combined New England City and Town Areas (CNECTAs)
  • Combined Statistical Areas
  • Consolidated Cities
  • Core Based Statistical Areas (CBSA - Metropolitan and Micropolitan Statistical Areas)
  • Counties
  • County Subdivisions
  • Metropolitan Divisions
  • NECTA Divisions
  • New England City and Town Areas (NECTAs)
  • Places
  • School Districts – Elementary
  • School Districts – Secondary
  • School Districts – Unified
  • State Legislative Districts – Lower Chamber
  • State Legislative Districts – Upper Chamber
  • States
  • Subminor Civil Divisions
  • Tribal Tracts
  • ZIP Code Tabulation Areas (ZCTAs)

Download Tiger shapefiles with demographics here

Mike

Saturday, September 1, 2012

New Zip Code with Demographics Shapefiles Available

Hello - Many of you have purchased our Zip Code Boundary Shapefiles over the last year. We appreciate that. We now have Zip Code boundaries based on U.S Census TIGER/Line data PLUS 180 demographic fields from the 2010 U.S. Census.

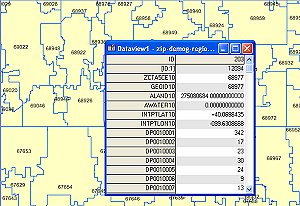
Download the new Zip Code plus demographics shapefiles here.

Saturday, August 25, 2012

JOSM Java based editor for OpenStreetMap

I've been taking a harder look at OpenStreetMap.org lately. As I learned more about the project, it became clear that JOSM was the editing tool of choice for creators and users of OpenStreetMap geodata.

Learn more about the JOSM editor and more about OpenStreetMap here.

Best,

Mike

Monday, July 30, 2012

Free One Million-Scale GIS Shapefiles to Download and Use as You Please

New one million-scale shapefiles are available from the National Atlas team. They include the following categories of shapefiles: U.S. boundaries, map reference, transportation and water. You can download these for free and use them in any manner that you please.

Learn more about the new one million-scale shapefiles

Saturday, June 23, 2012

National Weather Service Extreme and Hazardous Weather Alerts Maps

The National Weather Service is inviting you to comment on their new extreme and hazardous weather alerts maps. They show alerts for the nation and by state as well. Very comprehensive and include every imaginable alert.

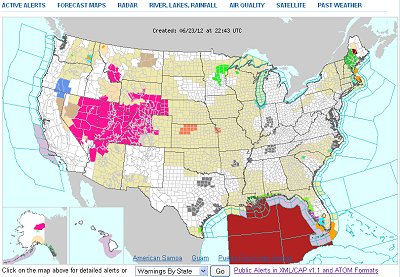
Learn more and preview the National Weather Service alerts maps

Saturday, June 16, 2012

Why is Yosemite Closing Less Expensive Lodging Due to Rock Fall Risk? More Die in a Few Years Falling on Rocks than 155 Years of Rocks Falling on People

I just read that Yosemite National Park is closing many of the least expensive lodgings due to the risk of rock falls. I did a little bit of research and found that in 155 years, 15 people have been killed by rock falls in the park. I also found that more people are killed by falling on rocks in the park in just a year or two. Does this make any sense at all?

Read more, view maps and download reports

Thursday, May 17, 2012

IPCC Climate Change GIS Shapefiles at Discount

Hello - You can now purchase multiple regions of the IPCC-based GIS shapefiles at a discount. The regular price for each region's shapefile set (each region has multiple decades from 2010 through 2099)is $47, but you can purchase regions 1 through 5 or regions 6 through 10 (either temperature or precipitation) for $197 saving $38 over the cost of purchasing individually.

These shapefiles are based on the latest IPCC climate data and indicate precipitation and temperature scenarios for 2010, 2020, 2030, 2040, 2050, 2060, 2070, 2080, 2090 and 2099.

Click here to access the IPCC-based climate change shapefiles

Click here to access the IPCC-based climate change shapefiles

Wednesday, May 9, 2012

Map Used in Bogus Article About Obama Supposedly Ceding Islands to Russia

I'm continually amazed at how totally bogus claims, with no basis in fact, circulate around the net and become "fact" to many. Here's a map that was used in an article claiming that the Obama administration was giving away oil rich islands to Russia. The map clearly shows a line and the islands marked are clearly on the Russian side. That's a clue, at least it was for me. Here's the map and you can read more about it here.

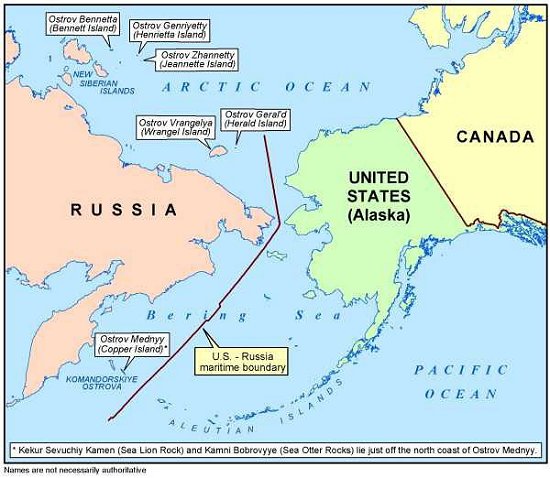
Read more about Obama bashing claim of oil-rich island giveaway here

MapCruzin.com Online since 1996 providing free GIS software, shapefiles, maps and tutorials.

Friday, April 20, 2012

Trying to Find the Best Location for Solar Energy? Solar Prospector

The National Renewable Energy Laboratory (NREL) has created this great tool called the Solar Prospector. It allows you to locate any point or area in the U.S. and Northern Mexico and determine its suitability for optimal solar energy production.


Learn More About the Solar Prospector Interactive Maps

Sunday, April 15, 2012

Extreme Weather: Long-Term U.S. Tornado Climatology Report

I've added a new report to the Extreme Weather, Natural Disaster, Tornado, Weather Warning, Climate Change Maps, GIS Shapefiles & Resources. The Long-Term U.S. Tornado Climatology Report comes from NOAA/NCDC.

The report is over 10 years old, but it's interesting that a lot of the tornado incidents agreed with the forecasts they created at the time. Now in 2012 it seems that forecasting the future of tornadoes or any extreme weather with any degree of accuracy is becoming increasingly difficult.

Check out the Long-Term U.S. Tornado Climatology Report

Mike Meuser

GIS Project Development, Data Research and Custom Shapefile Creation
Free GIS Software, Shapefiles, Maps and Tutorials
Free GPS, Aerial, TOPO Maps and News

If you have data, GIS project or custom shapefile needs send me an email

Premium Shapefiles: ZipCode, Indian & Federal Lands, School Districts, Tornadoes, Dams, Climate Change & Global Warming

Saturday, April 14, 2012

Extreme Weather, Storms in the West yet the U.S. Drought Worsens

I just reviewed the drought monitor and the drought impact reporter. I thought with all of the recent extreme weather around the U.S. and snow and rain in the West that I'd find that conditions have gotten better. Not so! Many states are experiencing no better conditions and in many cases conditions have worsened. Many states are in moderate to extreme drought and Texas is still experiencing extreme and exceptional drought conditions.

The drought impact reporter is especially interesting. If you click on a state you will find articles, listed on the right hand side, that offer the current news about regional drought conditions.


Mike Meuser

MapCruzin.com for free GIS software, shapefiles, maps and tutorials.
Check out Premium GIS Shapefiles : Zip Code Boundaries, School Districts, Tornadoes, Dams & Risks, Indian & Federal Lands, and Climate Change.

Friday, March 23, 2012

Blue Creek Ah Pah in the New York Times

I think you'll find this interesting. I began working on the Blue Creek Ah Pah Traditional Yurok Village about 5 years ago. I've many things including develop the website, host the website, make GIS maps, take photos and videos, create power point presentation and brochures. I'v also contributed many volunteer hours, supplied tools and old growth redwood planks.

A couple of days ago the New York Times published an article about the village project. Check out the article, A Vision of Reviving Tribal Ways in a Remote Corner of California.

You might also be interested in the maps I created for the project.


Best

Mike

Tuesday, March 13, 2012

Investigate Possible Future Effects of Climate Change in the U.S.

Comparisons and Research Using the Climate Change GIS Shapefiles

Using the data one could look at things like increases or decreases in temperature and precipitation over decades for any area or region in the contiguous U.S. of interest. All sorts of interesting comparisons may result for example, higher precipitation along with lower temperatures may indicate more snowfall and less rain. An increase in temperature later in the year may indicate a flood risk as the snowpack melts. You can probably imagine all sorts of scenarios to investigate with this data.

Data Units

Temperature: The monthly figures within each year represent the air temperature in degrees in K (Kelvin). You can convert K to Farenheit using the following formula:

F = (K - 273.15) * 9/5 + 32

or convert to Centigrade using this formula:

C = K - 273.15

Precipitation: The monthly figures within each year represent the precipitation in mm (milimeters). You can convert mm to inches using the following conversion factor:

1 millimeter = 0.0393700787 inch

or convert mm to cm (centimeters) using the following conversion factor:

1 millimeter = 0.1 centimeters

Click here to access the Climate Change GIS Shapefiles

Mike Meuser

GIS Project Development, Data Research and Custom Shapefile Creation
Free GIS Software, Shapefiles, Maps and Tutorials
Free GPS, Aerial, TOPO Maps and News

If you have data, GIS project or custom shapefile needs send me an email

Premium Shapefiles: ZipCode, Indian & Federal Lands, School Districts, Tornadoes, Dams, Climate Change & Global Warming


Monday, March 12, 2012

James Hansen Speaks Out About Climate Change

Speaks about how close we are to a tipping point to a point of no return and runaway climate extremes. Also speaks of the immorality of leaving this out of control climate to future generations especially since we know how to stop it. Finally, he introduces a simple fee system to reduce greenhouse gases and stimulate the economy.

View James Hansen Speaks Out About Climate Change

Mike Meuser

GIS Project Development, Data Research and Custom Shapefile Creation
Free GIS Software, Shapefiles, Maps and Tutorials
Free GPS, Aerial, TOPO Maps and News

If you have data, GIS project or custom shapefile needs send me an email

Premium Shapefiles: ZipCode, Indian & Federal Lands, School Districts, Tornadoes, Dams, Climate Change & Global Warming


Sunday, March 11, 2012

One Year Since Fukushima - Maps, Video, Shapefiles, Events

Today is the one year anniversary of the nuclear disaster at Fukushima. I've collected some lists of events today and tomorrow as well as a new movie about the disaster. There are also free maps, images and shapefiles to help you with your nuclear energy research.

Visit One Year Since Fukushima - Maps, Video, Shapefiles, Events Now

Mike Meuser

GIS Project Development, Data Research and Custom Shapefile Creation
Free GIS Software, Shapefiles, Maps and Tutorials
Free GPS, Aerial, TOPO Maps and News

If you have data, GIS project or custom shapefile needs send me an email

Premium Shapefiles: ZipCode, Indian & Federal Lands, School Districts, Tornadoes, Dams, Climate Change & Global Warming


Tuesday, March 6, 2012

120 Million People in the United States at Risk to Fukushima-Like Nuclear Accident

NRDC has just published a new interactive map showing the 104 nuclear reactors at the 65 nuclear power plant facilities in the United States. 23 of these are identical to the reactors at Fukushima and none have had any safety upgrades. I have provided maps and GIS shapefiles and a link to the new NRDC interactive maps here.


Mike Meuser

GIS Project Development, Data Research and Custom Shapefile Creation
Free GIS Software, Shapefiles, Maps and Tutorials
Free GPS, Aerial, TOPO Maps and News

If you have data, GIS project or custom shapefile needs send me an email

Premium Shapefiles: ZipCode, Indian & Federal Lands, School Districts, Tornadoes, Dams, Climate Change & Global Warming


Monday, February 6, 2012

Worldwide Coal Consumption Nearly Doubles Since 1980

The U.S. EIA (Energy Information Administration has created animated maps to show the near doubling of coal consumption. Most of this increase has been due to demand in Asia.


This is an excellent example of how animated flashmaps can tell a story in a very interesting, succinct and powerful manner.

Learn more about creating flashmaps here

Learn more and view animated coal consumption maps here

Mike Meuser

GIS Project Development, Data Research and Custom Shapefile Creation
Free GIS Software, Shapefiles, Maps and Tutorials
Free GPS, Aerial, TOPO Maps and News

If you have data, GIS project or custom shapefile needs send me an email

Premium Shapefiles: ZipCode, Indian & Federal Lands, School Districts, Tornadoes, Dams, Climate Change & Global Warming


Wednesday, February 1, 2012

San Onofre Nuclear Power Plant Shutdown Due to Leak

Million of folks in Southern California are at risk to nuclear radiation leaks. Read more about Tuesday afternoon's leak at San Onofre and access related details, maps and shapefiles.

Access San Onofre Nuclear Plant Shutdown due to Leak details, Maps and GIS Shapefiles


Mike Meuser

GIS Project Development, Data Research and Custom Shapefile Creation
Free GIS Software, Shapefiles, Maps and Tutorials
Free GPS, Aerial, TOPO Maps and News

If you have data, GIS project or custom shapefile needs send me an email

Premium Shapefiles: ZipCode, Indian & Federal Lands, School Districts, Tornadoes, Dams, Climate Change & Global Warming