
This is an excellent example of how animated flashmaps can tell a story in a very interesting, succinct and powerful manner.
Learn more about creating flashmaps here
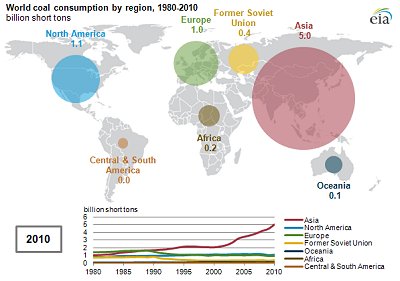
Learn more and view animated coal consumption maps here
Mike Meuser
GIS Project Development, Data Research and Custom Shapefile Creation
Free GIS Software, Shapefiles, Maps and Tutorials
Free GPS, Aerial, TOPO Maps and News
If you have data, GIS project or custom shapefile needs send me an email
Premium Shapefiles: ZipCode, Indian & Federal Lands, School Districts, Tornadoes, Dams, Climate Change & Global Warming

