
IPCC 4th Assessment scenario A2 temperature and precipitation GIS shapefile map layers for the years 2010, 2020, 2030, 2040, 2050, 2060, 2070, 2080, 2090 and 2099. The data points are spaced approximately 4.5 km (2.8 miles) apart. The data covers the lower 48 United States. Each point includes data for each of the 12 months of the year, making comparisons and calculations of increases or decreases between months and decades possible.
About the A2 Scenario
The A2 storyline and scenario family describes a very differentiated and heterogeneous world. The underlying theme is self-reliance and preservation of local identities. Emphasis on economic, social, and cultural interactions between regions is less than in other storylines. Fertility patterns across regions converge very slowly, which results in high population growth. Economic development is uneven, the income gap between now-industrialized and developing parts of the world does not narrow, and per capita economic growth and technological change are more fragmented and slower than in other storylines. Main characteristics A2 scenario include: high population growth, medium GDP growth, high energy use, medium-high land use changes, low resource (mainly oil and gas) availability, slow pace and direction of technological change favoring regional economic development.
In addition to each GIS shapefile map layer, you get base map layers including cities, roads, rivers, states and water bodies.
Download Climate Change Temperature and Precipitation GIS Shapefiles
Saturday, June 19, 2010


Wednesday, June 16, 2010
Climate Change Impacts in the United States Charts, Maps and Graphs
The disasterous BP gulf oil spill helps bring the effects of our carbon based energy generation into focus. Our carbon-based energy consumption not only has immediate effects like oil spills, surface and air pollution, but also long-term effects like global warming and climate change.
At MapCruzin.com we are working on sets of climate change and global warming GIS shapefiles. The data points are spaced approximately 4.5 km (2.8 miles) apart and are based on the IPCC 4th Assessment A2 Scenario. In the future we will be creating more shapefiles based on other IPCC scenarios.
The IPCC A2 scenario based GIS shapefiles will be available this week at MapCruzin.com. In the meantime, check out the following related charts:
Climate Change Impacts in the United States Maps, Charts, Tables, Chapter 4: Energy Supply and Use
High Resolution images from the 2009 Climate Change Impacts in the United States, Chapter 4, Energy Supply and Use.
Note that these JPG images may be larger than they appear in your browser. While viewing the images, you may save them to your computer to view them in their full high resolution format.
Image 1 - EPA Chart showing that 87% of greenhouse gas emissions is the result of energy production and use.
Image 2 - Pie Chart showing coal, nuclear and natural gas accounting for 90% of U.S. energy production.
Image 3 - Graph showing how U.S. energy use is dominated by oil and other fossil fuels.
Image 4 - Bar chart showing cooling and heating degree days based on various scenarios.
Image 5 - Map of U.S. showing population change and increasing population in regions that require air conditioning.
Image 6 - Bar chart showing number of incidents caused by extreme weather has increased tenfold since 1992.
Download Climate Change Impacts in the United States Charts, Maps and Graphs
At MapCruzin.com we are working on sets of climate change and global warming GIS shapefiles. The data points are spaced approximately 4.5 km (2.8 miles) apart and are based on the IPCC 4th Assessment A2 Scenario. In the future we will be creating more shapefiles based on other IPCC scenarios.
The IPCC A2 scenario based GIS shapefiles will be available this week at MapCruzin.com. In the meantime, check out the following related charts:
Climate Change Impacts in the United States Maps, Charts, Tables, Chapter 4: Energy Supply and Use
High Resolution images from the 2009 Climate Change Impacts in the United States, Chapter 4, Energy Supply and Use.
Note that these JPG images may be larger than they appear in your browser. While viewing the images, you may save them to your computer to view them in their full high resolution format.
Image 1 - EPA Chart showing that 87% of greenhouse gas emissions is the result of energy production and use.
Image 2 - Pie Chart showing coal, nuclear and natural gas accounting for 90% of U.S. energy production.
Image 3 - Graph showing how U.S. energy use is dominated by oil and other fossil fuels.
Image 4 - Bar chart showing cooling and heating degree days based on various scenarios.
Image 5 - Map of U.S. showing population change and increasing population in regions that require air conditioning.
Image 6 - Bar chart showing number of incidents caused by extreme weather has increased tenfold since 1992.
Download Climate Change Impacts in the United States Charts, Maps and Graphs
Climate Change Impacts in the United States High Resolution Images
The disasterous BP gulf oil spill helps bring the effects of our carbon based energy generation into focus. Our carbon-based energy consumption not only has immediate effects like oil spills, surface and air pollution, but also long-term effects like global warming and climate change.
At MapCruzin.com we are working on sets of climate change and global warming GIS shapefiles. The data points are spaced approximately 4.5 km (2.8 miles) apart and are based on the IPCC 4th Assessment A2 Scenario. In the future we will be creating more shapefiles based on other IPCC scenarios.
The IPCC A2 scenario based GIS shapefiles will be available this week at MapCruzin.com. In the meantime, check out the following related charts:
Climate Change Impacts in the United States Maps, Charts, Tables, Chapter 1: Global Climate Change
High Resolution images from the 2009 Climate Change Impacts in the United States, Chapter 1, Global Climate Change.
Note that these JPG images may be larger than they appear in your browser. While viewing the images, you may save them to your computer to view them in their full high resolution format.
Image 1 - Chart of carbon dioxide (CO2) concentration over last 800,000 years.
Image 2 - Chart of carbon dioxide (CO2) concentration over last 2,000 years.
Image 3 - Chart of natural and man-made cooling and warming effects.
Image 4 - Chart of global average temperature 1880 to 2008.
Image 5 - Chart of glacial ice decline 1960 to 2008.
Image 6 - Chart showing climate change with and without human impacts.
Image 7 - Chart of solar radiation vs. global surface temperature 1978 to 2006.
Image 8 - Charts comparing global warming due to various factors.
Image 9 - Charts showing emissions of CO2 and concentration of CO2 in atmosphere.
Image 10 - Charts showing projected changes in heaviest precipitation events 1900 to 2099.
Image 11 - Charts showing projected changes in global temperature under three IPCC scenarios 1900 to 2099.
Download Climate Change Impacts in the United States Charts
At MapCruzin.com we are working on sets of climate change and global warming GIS shapefiles. The data points are spaced approximately 4.5 km (2.8 miles) apart and are based on the IPCC 4th Assessment A2 Scenario. In the future we will be creating more shapefiles based on other IPCC scenarios.
The IPCC A2 scenario based GIS shapefiles will be available this week at MapCruzin.com. In the meantime, check out the following related charts:
Climate Change Impacts in the United States Maps, Charts, Tables, Chapter 1: Global Climate Change
High Resolution images from the 2009 Climate Change Impacts in the United States, Chapter 1, Global Climate Change.
Note that these JPG images may be larger than they appear in your browser. While viewing the images, you may save them to your computer to view them in their full high resolution format.
Image 1 - Chart of carbon dioxide (CO2) concentration over last 800,000 years.
Image 2 - Chart of carbon dioxide (CO2) concentration over last 2,000 years.
Image 3 - Chart of natural and man-made cooling and warming effects.
Image 4 - Chart of global average temperature 1880 to 2008.
Image 5 - Chart of glacial ice decline 1960 to 2008.
Image 6 - Chart showing climate change with and without human impacts.
Image 7 - Chart of solar radiation vs. global surface temperature 1978 to 2006.
Image 8 - Charts comparing global warming due to various factors.
Image 9 - Charts showing emissions of CO2 and concentration of CO2 in atmosphere.
Image 10 - Charts showing projected changes in heaviest precipitation events 1900 to 2099.
Image 11 - Charts showing projected changes in global temperature under three IPCC scenarios 1900 to 2099.
Download Climate Change Impacts in the United States Charts
Saturday, May 29, 2010
CIA Maps of the World Countries and Regions in High Resolution Formats
Free High Resolution Maps of World Regions
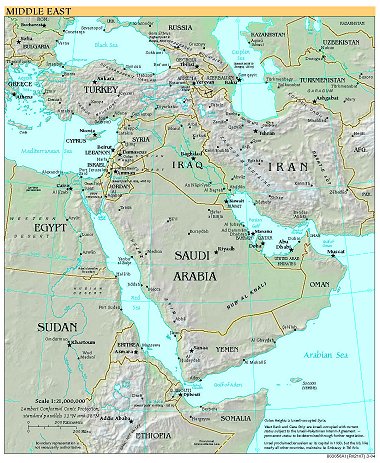
Exceptionally nice collection of high quality map images from the CIA World Factbook 2008. Below are some low resolution sample images. Click on the links below to access the high resolution maps in jpg and pdf format.
Here's a low resolution sample of the Middle-East map with a zoomed in portion below it that was captured from the PDF format map.
Download CIA Maps of the World Countries and Regions
Exceptionally nice collection of high quality map images from the CIA World Factbook 2008. Below are some low resolution sample images. Click on the links below to access the high resolution maps in jpg and pdf format.
Here's a low resolution sample of the Middle-East map with a zoomed in portion below it that was captured from the PDF format map.
Download CIA Maps of the World Countries and Regions
ToxicRisk.com Toxic Chemicals and School Children
Introduction
Our Google Maps mashup project is based upon EPA Toxic Release Inventory (TRI) data released March 19,2009 and schools in the U.S. Links are provided to RTK Net for detailed chemical pollution release data and Scorecard for chemical information.
Toxic Chemical Pollution Releases and Schools

As you zoom in you will see a change in the icons of the facilities near the center of the map - these are the ones that you can click on and find the facility name, number of schools within 1 mile and number of schools within 5 miles of the facility plus a link to a database about the toxic history of the facility. You can also click on a chemical to learn more about associated risks. The schools will appear as you zoom in. As you zoom in further, you will see the school icon change - at that point you can click on the school to view its name.
Using the Maps
Zoom in or enter some search criteria to begin your discovery of toxic chemical risks near your schools and in your community. Note that a search brings you to a fairly zoomed in map. You may wish to zoom out a bit to see what toxics might be in the surrounding region.
For 2007, 21,996 facilities, including federal facilities, reported to the TRI Program. They reported 4.1 billion pounds of on-site and off-site disposal or other releases of the almost 650 toxic chemicals. Click here for more about EPA's Toxic Release Inventory.
Very Short History of the Toxic Release Inventory (TRI)
The Bhopal disaster or Bhopal gas tragedy was an industrial disaster that took place at a Union Carbide subsidiary pesticide plant in the city of Bhopal, India. On 3 December 1984, the plant released 42 tons of toxic methyl isocyanate (MIC) gas, exposing more than 500,000 people to toxic gases. The first official immediate death toll was 2,259. A more probable figure is that 8,000 died within two weeks, and it is estimated that an additional 8,000 have since died from gas-related diseases.
The short story is that the U.S. responded to this disaster by introducing the Toxic Release Inventory (TRI) in 1987. While the TRI does not cover all of the toxic risks we face in our neighborhoods, it is a good place to start to build a community toxic inventory. See below for the other data that will soon be added to the maps allowing you to build a more comprehensive community toxic inventory.
Shapefile Downloads
To enable you to create your own community toxics inventory, we have prepared Toxic Release Inventory GIS shapefiles for you to download. These come packaged with base layers like state boundaries, waterways, roads, etc. You don't have to be a GIS professional to use these. They also come packaged with instructions for using these with our free Lear2Map GIS Tutorial and Atlas.
TRI with Google Earth
We have also prepared Google Earth maps based on the TRI data.
Missing Data
Unfortunately, after all these years and with the availability of GPS technology, there are still hundreds of facilities that report no latitude or longitude. We have prepared Excel spreadsheets for you to download so that you can see the facilities that are not on the maps at present. If you have information about the location of facilities that are missing or mis-located, please email me. With your help, we'll make the data more accurate for everyone.
Community Toxic Risk Maps
Currently we have two projects at ToxicRisk.com. The first is map-based using the latest Toxic Release Inventory (TRI) data released March 19, 2009. The second is a searchable database of EPA Risk Management Plans (RMP) submitted to EPA in 1999. In the near future we will be adding this data to the maps as well as the more recent 2004 RMP submissions. For more about the Risk Management Plan, visit EPA's Risk Management Plan website.
More Coming in our Community Toxic Risk Mapping Series
In the near future we'll be adding the following to our database and maps. Be sure to also check out our Google Earth Maps of the recenlty released Toxic Release Inventory data. Note that all of our data is obtained from publicly available websites provided by RTK Net and the U.S. EPA:
Risk Management Plans (RMP)
The RMP includes an accident history, chemicals stored on-site, emergency response plans and much more. This data is much more useful but is not nearly as available to the public as the TRI. In fact, the most important portion - the worst case scenarios in case of an accidental release - were never distributed widely. Check our resources for more about this. We have provided a data search of the RMP that is based on the 1999 submissions - the first round of reports. In the near future we will be adding this data plus the latest (2004) submission to the toxic risk maps.
Water Pollution (PCS)
The EPA PCS is a national computerized management information system that automates entry, updating, and retrieval of National Pollutant Discharge Elimination System (NPDES) data and tracks permit issuance, permit limits and monitoring data, and other data pertaining to facilities regulated under NPDES. The NPDES permit program regulates direct discharges from municipal and industrial wastewater treatment facilities that discharge into the navigable waters of the United States. Wastewater treatment facilities (also called "point sources") are issued NPDES permits regulating their discharge. Reports for those facilities identified by EPA as "Major" include the names and amounts of chemicals and other substances that are discharged.
Superfund Sites NPL
Information on Superfund sites was obtained from the Comprehensive Environmental Response, Compensation and Liability Information System (CERCLIS), which is the official repository for site and non-site specific Superfund data in support of the Comprehensive Environmental Response, Compensation, and Liability Act (CERCLA, or Superfund). Sites are placed on the National Priorities List (NPL) by EPA if they have uncontrolled releases of hazardous substances that are priorities for long-term remediation and response.
Superfund Sites "No Further Action"
There are approximately 24,000 sites that have been included in CERCLIS in the past, but for which EPA requires no further action under the Federal Superfund program.
Superfund Sites NOT on NPL
These are Superfund sites where there is ongoing Federal interest or potential Federal activity, but where the hazard posed is not sufficiently significant or time-critical for the site to be placed on the NPL.
Toxic Release Inventory (TRI)
The TRI System (TRIS) contains data submitted to EPA by regulated facilities concerning chemicals and chemical categories listed by the Agency under Section 313 of the Emergency Planning and Community Right-to-Know Act. Data contained in the system include chemicals present, amount of on-site use, releases and off-site transfers (including Publicly-Owned Treatment Works, POTWs), on-site treatment, and minimization/prevention actions. TRIS contains information about releases and transfers of more than 600 toxic chemicals and compounds to the environment. We have included data for TRI facilities that reported their 1997 releases and transfers. Further data and information about the facility and chemicals released and transferred are provided through links to RTK Net.
Hazardous Waste Facilities
Information contained in the Hazardous Waste information is taken from the EPA Biennial Reporting System (BRS). It contains information on facilities that treat, store, or dispose (TSD) of RCRA hazardous wastes or are classified as Large Quantity Generators (LQGs) under RCRA. A RCRA hazardous waste is a waste that is both (a) described by one or more federal RCRA waste codes, and (b) is not exempted from RCRA regulations. RCRA classifies as LQG a facility that either (a) generated 1,000 kg or more of RCRA hazardous waste in a single month; (b) generated in a single month or accumulated at any time 1 kg of RCRA acute hazardous waste; or (c) generated or accumulated at any time more than 100 kg of spill clean up material contaminated with a RCRA acute hazardous waste. Reports for those facilities identified by EPA as "Waste Managers" list amount and type of disposal.
AIRS Facilities
EPA's Office of Air and Radiation stores information on air quality, point source emissions, and area/mobile source data required by federal regulation from the 50 states in its Aerometric Information Retrieval System (AIRS). States are required by the Code of Federal Regulations (CFR) to report to EPA annual emissions estimates for point sources emitting greater than or equal to 100 tons per year of volatile organic compounds (VOCs), nitrogen dioxide (NO2), sulfur dioxide (SO2), particulate matter less than 10 microns in size (PM-10); 1000 tons per year of carbon monoxide (CO); or 5 tons per year of lead (Pb). The Clean Air Act Amendments also require states to report emissions data for point sources in areas where air pollution exceeds Federal standards (nonattainment areas).
Please note that this website does NOT provide the Offsite Consequence Analysis section of the Risk Management Plans as provided by law. Please see our resources for more about this important issue.
Update: September 16, 2009 A.M. - Zeros Count
Using the raw EPA data, many facility reports show zero releases. RTK Net has a different (and we think, better) approach to this. We will be switching to the RTK Net TRI data. Click here for more about this.
Update: June 28, 2009 P.M. - Chemicals linked to Scorecard.org
Each chemical a facility released is now linked to the Scorecard.org website. At Scorecard.org you will be able to find out much more about the chemical released near your schools and in your neighborhoods. Details include such things as: human health hazards, hazard rankings, chemical use profile, ranking of chemicals by reported environmental releases in the United States, regulatory coverage, basic testing to identify chemical hazards, and information still needed for safety assessment.
Update: April 20, 2009 P.M. - Schools Added to Maps
We have added schools to the maps. The maps are now a bit faster and easier to navigate. As you zoom in you will see a change in the icons of the facilities near the center of the map - these are the ones that you can click on and find the facility name, number of schools within 1 mile and number of schools within 5 miles of the facility plus a link to a database about the toxic history of the facility. The schools will appear as you zoom in. As you zoom in further, you will see the school icon change - at that point you can click on the school to view its name.
Note that ToxicRisk.com is based on 2007 TRI data. The 2008 TRI data is now available and, as we find the resources to do so, we hope to update with the new data soon.
Go to ToxicRisk.com Now
Learn More About and Access the 2008 TRI Data Released December 2009
Our Google Maps mashup project is based upon EPA Toxic Release Inventory (TRI) data released March 19,2009 and schools in the U.S. Links are provided to RTK Net for detailed chemical pollution release data and Scorecard for chemical information.
Toxic Chemical Pollution Releases and Schools
As you zoom in you will see a change in the icons of the facilities near the center of the map - these are the ones that you can click on and find the facility name, number of schools within 1 mile and number of schools within 5 miles of the facility plus a link to a database about the toxic history of the facility. You can also click on a chemical to learn more about associated risks. The schools will appear as you zoom in. As you zoom in further, you will see the school icon change - at that point you can click on the school to view its name.
Using the Maps
Zoom in or enter some search criteria to begin your discovery of toxic chemical risks near your schools and in your community. Note that a search brings you to a fairly zoomed in map. You may wish to zoom out a bit to see what toxics might be in the surrounding region.
For 2007, 21,996 facilities, including federal facilities, reported to the TRI Program. They reported 4.1 billion pounds of on-site and off-site disposal or other releases of the almost 650 toxic chemicals. Click here for more about EPA's Toxic Release Inventory.
Very Short History of the Toxic Release Inventory (TRI)
The Bhopal disaster or Bhopal gas tragedy was an industrial disaster that took place at a Union Carbide subsidiary pesticide plant in the city of Bhopal, India. On 3 December 1984, the plant released 42 tons of toxic methyl isocyanate (MIC) gas, exposing more than 500,000 people to toxic gases. The first official immediate death toll was 2,259. A more probable figure is that 8,000 died within two weeks, and it is estimated that an additional 8,000 have since died from gas-related diseases.
The short story is that the U.S. responded to this disaster by introducing the Toxic Release Inventory (TRI) in 1987. While the TRI does not cover all of the toxic risks we face in our neighborhoods, it is a good place to start to build a community toxic inventory. See below for the other data that will soon be added to the maps allowing you to build a more comprehensive community toxic inventory.
Shapefile Downloads
To enable you to create your own community toxics inventory, we have prepared Toxic Release Inventory GIS shapefiles for you to download. These come packaged with base layers like state boundaries, waterways, roads, etc. You don't have to be a GIS professional to use these. They also come packaged with instructions for using these with our free Lear2Map GIS Tutorial and Atlas.
TRI with Google Earth
We have also prepared Google Earth maps based on the TRI data.
Missing Data
Unfortunately, after all these years and with the availability of GPS technology, there are still hundreds of facilities that report no latitude or longitude. We have prepared Excel spreadsheets for you to download so that you can see the facilities that are not on the maps at present. If you have information about the location of facilities that are missing or mis-located, please email me. With your help, we'll make the data more accurate for everyone.
Community Toxic Risk Maps
Currently we have two projects at ToxicRisk.com. The first is map-based using the latest Toxic Release Inventory (TRI) data released March 19, 2009. The second is a searchable database of EPA Risk Management Plans (RMP) submitted to EPA in 1999. In the near future we will be adding this data to the maps as well as the more recent 2004 RMP submissions. For more about the Risk Management Plan, visit EPA's Risk Management Plan website.
More Coming in our Community Toxic Risk Mapping Series
In the near future we'll be adding the following to our database and maps. Be sure to also check out our Google Earth Maps of the recenlty released Toxic Release Inventory data. Note that all of our data is obtained from publicly available websites provided by RTK Net and the U.S. EPA:
Risk Management Plans (RMP)
The RMP includes an accident history, chemicals stored on-site, emergency response plans and much more. This data is much more useful but is not nearly as available to the public as the TRI. In fact, the most important portion - the worst case scenarios in case of an accidental release - were never distributed widely. Check our resources for more about this. We have provided a data search of the RMP that is based on the 1999 submissions - the first round of reports. In the near future we will be adding this data plus the latest (2004) submission to the toxic risk maps.
Water Pollution (PCS)
The EPA PCS is a national computerized management information system that automates entry, updating, and retrieval of National Pollutant Discharge Elimination System (NPDES) data and tracks permit issuance, permit limits and monitoring data, and other data pertaining to facilities regulated under NPDES. The NPDES permit program regulates direct discharges from municipal and industrial wastewater treatment facilities that discharge into the navigable waters of the United States. Wastewater treatment facilities (also called "point sources") are issued NPDES permits regulating their discharge. Reports for those facilities identified by EPA as "Major" include the names and amounts of chemicals and other substances that are discharged.
Superfund Sites NPL
Information on Superfund sites was obtained from the Comprehensive Environmental Response, Compensation and Liability Information System (CERCLIS), which is the official repository for site and non-site specific Superfund data in support of the Comprehensive Environmental Response, Compensation, and Liability Act (CERCLA, or Superfund). Sites are placed on the National Priorities List (NPL) by EPA if they have uncontrolled releases of hazardous substances that are priorities for long-term remediation and response.
Superfund Sites "No Further Action"
There are approximately 24,000 sites that have been included in CERCLIS in the past, but for which EPA requires no further action under the Federal Superfund program.
Superfund Sites NOT on NPL
These are Superfund sites where there is ongoing Federal interest or potential Federal activity, but where the hazard posed is not sufficiently significant or time-critical for the site to be placed on the NPL.
Toxic Release Inventory (TRI)
The TRI System (TRIS) contains data submitted to EPA by regulated facilities concerning chemicals and chemical categories listed by the Agency under Section 313 of the Emergency Planning and Community Right-to-Know Act. Data contained in the system include chemicals present, amount of on-site use, releases and off-site transfers (including Publicly-Owned Treatment Works, POTWs), on-site treatment, and minimization/prevention actions. TRIS contains information about releases and transfers of more than 600 toxic chemicals and compounds to the environment. We have included data for TRI facilities that reported their 1997 releases and transfers. Further data and information about the facility and chemicals released and transferred are provided through links to RTK Net.
Hazardous Waste Facilities
Information contained in the Hazardous Waste information is taken from the EPA Biennial Reporting System (BRS). It contains information on facilities that treat, store, or dispose (TSD) of RCRA hazardous wastes or are classified as Large Quantity Generators (LQGs) under RCRA. A RCRA hazardous waste is a waste that is both (a) described by one or more federal RCRA waste codes, and (b) is not exempted from RCRA regulations. RCRA classifies as LQG a facility that either (a) generated 1,000 kg or more of RCRA hazardous waste in a single month; (b) generated in a single month or accumulated at any time 1 kg of RCRA acute hazardous waste; or (c) generated or accumulated at any time more than 100 kg of spill clean up material contaminated with a RCRA acute hazardous waste. Reports for those facilities identified by EPA as "Waste Managers" list amount and type of disposal.
AIRS Facilities
EPA's Office of Air and Radiation stores information on air quality, point source emissions, and area/mobile source data required by federal regulation from the 50 states in its Aerometric Information Retrieval System (AIRS). States are required by the Code of Federal Regulations (CFR) to report to EPA annual emissions estimates for point sources emitting greater than or equal to 100 tons per year of volatile organic compounds (VOCs), nitrogen dioxide (NO2), sulfur dioxide (SO2), particulate matter less than 10 microns in size (PM-10); 1000 tons per year of carbon monoxide (CO); or 5 tons per year of lead (Pb). The Clean Air Act Amendments also require states to report emissions data for point sources in areas where air pollution exceeds Federal standards (nonattainment areas).
Please note that this website does NOT provide the Offsite Consequence Analysis section of the Risk Management Plans as provided by law. Please see our resources for more about this important issue.
Update: September 16, 2009 A.M. - Zeros Count
Using the raw EPA data, many facility reports show zero releases. RTK Net has a different (and we think, better) approach to this. We will be switching to the RTK Net TRI data. Click here for more about this.
Update: June 28, 2009 P.M. - Chemicals linked to Scorecard.org
Each chemical a facility released is now linked to the Scorecard.org website. At Scorecard.org you will be able to find out much more about the chemical released near your schools and in your neighborhoods. Details include such things as: human health hazards, hazard rankings, chemical use profile, ranking of chemicals by reported environmental releases in the United States, regulatory coverage, basic testing to identify chemical hazards, and information still needed for safety assessment.
Update: April 20, 2009 P.M. - Schools Added to Maps
We have added schools to the maps. The maps are now a bit faster and easier to navigate. As you zoom in you will see a change in the icons of the facilities near the center of the map - these are the ones that you can click on and find the facility name, number of schools within 1 mile and number of schools within 5 miles of the facility plus a link to a database about the toxic history of the facility. The schools will appear as you zoom in. As you zoom in further, you will see the school icon change - at that point you can click on the school to view its name.
Note that ToxicRisk.com is based on 2007 TRI data. The 2008 TRI data is now available and, as we find the resources to do so, we hope to update with the new data soon.
Go to ToxicRisk.com Now
Learn More About and Access the 2008 TRI Data Released December 2009
Tuesday, May 25, 2010
World Oil Reserves, Production and Exploration Free Map Downloads
Here are some free oil reserve, production and exploration maps.
World - Crude Oil Seaborne Trade 1994 (IMO) [PDF]
World - Oil Reserves (Energy Bulletin)
World - Oil Reserves (The Independent)
Africa - Geology, Oil and Gas Fields - Clickable Map (USGS)
Arabian Peninsula Geology, Oil and Gas Fields - Clickable Map (USGS)
Arctic - Geology, Oil and Gas Fields (USGS)
Asia - East - Geology, Oil and Gas Fields - Clickable Map (USGS)
Asia - South - Geology, Oil and Gas Fields - Clickable Map (USGS)
Asia - Southeast - Geology, Oil and Gas Fields - Clickable Map (USGS)
Australia and New Zealand - Geology, Oil and Gas Fields - Clickable Map (USGS)
Australia - Oil and Gas Pipelines (Pipeliner.com)
Australia, Western - Energy Map (Office of Energy) [PDF]
Barents Sea Region - Oil and Gas Development and Seabird Colonies (UNEP/GRID)
Canada - Alberta Oil Sands (Alberta Geological Society)
Canada - Alberta Oil Sands Lease Map (Canadian Oil Sands Trust)
Canada - British Columbia Petroleum Finder Map
Canada - British Columbia Offshore Petroleum Maps (B.C. Ministry of Energy and Mines)
Caspian Region Oil Pipelines, U.S. Central Intelligence Agency, April 2002 (PCL Map Collection) (633K) [PDF]
[Caspian Region] Oil and Gas Infrastructure in the Caspian Sea Region, CIA, March 2001 (PCL Map Collection) (2.5 MB)
China - Geology, Oil and Gas Fields - Clickable Map (USGS)
Europe - Crude Oil Pipelines (INOGATE)
Europe - Existing and Planned Natural Gas Pipelines to Europe (PCL Map Collection) from U.S. Energy Information Administration, Country Analysis Briefs, Major Russian Oil and Natural Gas Pipeline Projects, March 2005 (183K)
Europe - Geology, Oil and Gas Fields (USGS)
Europe - Natural Gas Pipelines (INOGATE)
Greece-Italy Gas Pipeline (Edison)
India - BG India Operations Map (BG India)
India - Energy Map from "India: An Energy Sector Overview", 1997, U.S. Energy Information Administration (PCL Map Collection) (55K)
India - Geology, Oil and Gas Fields - Clickable Map (USGS)
Iran - Geology, Oil and Gas Fields (USGS)
Iran - Key Petroleum Sector Facilities, portion of Iran Country Profile 2004, U.S. Central Intelligence Agency (PCL Map Collection) (318K)
Iran - Major Iranian Oilfields from U.S. Central Intelligence Agency map of Iran, 1978 (PCL Map Collection) (108K)
Iraq - Oil Infrastructure From Iraq: Country Profile [map], CIA (PCL Map Collection), January 2003 (157K) and pdf format (160K)
Iraq - Pipelines (Jerusalem Post)
Kazakhstan - Proposed Pipeline to China, July 2004, Central Intelligence Agency (PCL Map Collection) (898K) [PDF]
Kuwait - Oil Fields (MERIP)
New Zealand and Australia - Geology, Oil and Gas Fields - Clickable Map (USGS)
New Zealand - Petroleum Permit Maps (Ministry of Economic Development)
Nigeria - Niger Delta Petroleum System (USGS)
Norway - Norwegian Continental Shelf Energy Map (Aftenbladet)
Romania - Natural Gas Grid (Balkanenergy)
Russia - Geology, Oil and Gas Fields - Clickable Map (USGS)
Russia - Pipelines (BBC News)
[Russia to Europe] Existing and Planned Natural Gas Pipelines to Europe (PCL Map Collection) from U.S. Energy Information Administration, Country Analysis Briefs, Major Russian Oil and Natural Gas Pipeline Projects, March 2005 (183K)
Russia to Europe - Gas Pipelines (Centre for Eastern Studies)
South America - Geology, Oil and Gas Fields (USGS)
Ukraine Gas Pipelines (Eurotrib)
U.S. - Gas Price Map (GasBuddy)
U.S. - Alaska - Prudhoe Bay Map (Chubb Custom Cartography)
U.S. - Appalachian Region Oil and Gas Data Viewer (PTTC)
U.S. - New Mexico - Oil and Gas Wells Map Viewer (Go-Tech)
U.S. - Michigan - Petroleum and Natural Gas Maps (Michigan Public Service Commission)
U.S. - Natural Gas Pipeline Network (U.S. Energy Information Administration)
U.S. - Permian Basin (University of Texas, Bureau of Economic Geology)
U.S. - Texas Offshore Oil and Gas Divisions (Texas Railroad Commission) [PDF]
U.S. - Texas - Oil and Gas Maps (Railroad Commission of Texas)
U.S. - Utah - Geologic Resource Maps (Utah Geolgical Survey)
U.S. - Utah Oil and Gas Well Map Search (State of Utah, Division of Oil, Gas and Mining)
U.S. - Wyoming, Utah, Colorado - Oil Shale and Tar Sands Maps (OSTSEIS
View and download free oil reserves, production and exploration maps of the world
World - Crude Oil Seaborne Trade 1994 (IMO) [PDF]
World - Oil Reserves (Energy Bulletin)
World - Oil Reserves (The Independent)
Africa - Geology, Oil and Gas Fields - Clickable Map (USGS)
Arabian Peninsula Geology, Oil and Gas Fields - Clickable Map (USGS)
Arctic - Geology, Oil and Gas Fields (USGS)
Asia - East - Geology, Oil and Gas Fields - Clickable Map (USGS)
Asia - South - Geology, Oil and Gas Fields - Clickable Map (USGS)
Asia - Southeast - Geology, Oil and Gas Fields - Clickable Map (USGS)
Australia and New Zealand - Geology, Oil and Gas Fields - Clickable Map (USGS)
Australia - Oil and Gas Pipelines (Pipeliner.com)
Australia, Western - Energy Map (Office of Energy) [PDF]
Barents Sea Region - Oil and Gas Development and Seabird Colonies (UNEP/GRID)
Canada - Alberta Oil Sands (Alberta Geological Society)
Canada - Alberta Oil Sands Lease Map (Canadian Oil Sands Trust)
Canada - British Columbia Petroleum Finder Map
Canada - British Columbia Offshore Petroleum Maps (B.C. Ministry of Energy and Mines)
Caspian Region Oil Pipelines, U.S. Central Intelligence Agency, April 2002 (PCL Map Collection) (633K) [PDF]
[Caspian Region] Oil and Gas Infrastructure in the Caspian Sea Region, CIA, March 2001 (PCL Map Collection) (2.5 MB)
China - Geology, Oil and Gas Fields - Clickable Map (USGS)
Europe - Crude Oil Pipelines (INOGATE)
Europe - Existing and Planned Natural Gas Pipelines to Europe (PCL Map Collection) from U.S. Energy Information Administration, Country Analysis Briefs, Major Russian Oil and Natural Gas Pipeline Projects, March 2005 (183K)
Europe - Geology, Oil and Gas Fields (USGS)
Europe - Natural Gas Pipelines (INOGATE)
Greece-Italy Gas Pipeline (Edison)
India - BG India Operations Map (BG India)
India - Energy Map from "India: An Energy Sector Overview", 1997, U.S. Energy Information Administration (PCL Map Collection) (55K)
India - Geology, Oil and Gas Fields - Clickable Map (USGS)
Iran - Geology, Oil and Gas Fields (USGS)
Iran - Key Petroleum Sector Facilities, portion of Iran Country Profile 2004, U.S. Central Intelligence Agency (PCL Map Collection) (318K)
Iran - Major Iranian Oilfields from U.S. Central Intelligence Agency map of Iran, 1978 (PCL Map Collection) (108K)
Iraq - Oil Infrastructure From Iraq: Country Profile [map], CIA (PCL Map Collection), January 2003 (157K) and pdf format (160K)
Iraq - Pipelines (Jerusalem Post)
Kazakhstan - Proposed Pipeline to China, July 2004, Central Intelligence Agency (PCL Map Collection) (898K) [PDF]
Kuwait - Oil Fields (MERIP)
New Zealand and Australia - Geology, Oil and Gas Fields - Clickable Map (USGS)
New Zealand - Petroleum Permit Maps (Ministry of Economic Development)
Nigeria - Niger Delta Petroleum System (USGS)
Norway - Norwegian Continental Shelf Energy Map (Aftenbladet)
Romania - Natural Gas Grid (Balkanenergy)
Russia - Geology, Oil and Gas Fields - Clickable Map (USGS)
Russia - Pipelines (BBC News)
[Russia to Europe] Existing and Planned Natural Gas Pipelines to Europe (PCL Map Collection) from U.S. Energy Information Administration, Country Analysis Briefs, Major Russian Oil and Natural Gas Pipeline Projects, March 2005 (183K)
Russia to Europe - Gas Pipelines (Centre for Eastern Studies)
South America - Geology, Oil and Gas Fields (USGS)
Ukraine Gas Pipelines (Eurotrib)
U.S. - Gas Price Map (GasBuddy)
U.S. - Alaska - Prudhoe Bay Map (Chubb Custom Cartography)
U.S. - Appalachian Region Oil and Gas Data Viewer (PTTC)
U.S. - New Mexico - Oil and Gas Wells Map Viewer (Go-Tech)
U.S. - Michigan - Petroleum and Natural Gas Maps (Michigan Public Service Commission)
U.S. - Natural Gas Pipeline Network (U.S. Energy Information Administration)
U.S. - Permian Basin (University of Texas, Bureau of Economic Geology)
U.S. - Texas Offshore Oil and Gas Divisions (Texas Railroad Commission) [PDF]
U.S. - Texas - Oil and Gas Maps (Railroad Commission of Texas)
U.S. - Utah - Geologic Resource Maps (Utah Geolgical Survey)
U.S. - Utah Oil and Gas Well Map Search (State of Utah, Division of Oil, Gas and Mining)
U.S. - Wyoming, Utah, Colorado - Oil Shale and Tar Sands Maps (OSTSEIS
View and download free oil reserves, production and exploration maps of the world
Monday, May 17, 2010
Download Free EPA Geospatial Map Layers in ArcGIS Shapefile, KMZ and KML Formats Released April 20, 2010
Ever wanted to map all of the toxic facilities that EPA regulates? EPA now has their geospatial data online. The data includes the following:
- Superfund National Priorities List (NPL)
- RCRAInfo - EPA and State Treatment, Storage, Disposal facilities
- Toxic Release Inventory System - All reported years including the just released 2008 data
- Integrated Compliance Information System (ICIS) and
Permit Compliance System (PCS) - National Pollutant
Discharge Elimination System (NPDES) Majors
- RCRAInfo - Large Quantity Generators (LQG)
- Air Facility System (AFS) - Major discharges of air pollutants
- RCRAInfo - Corrective Actions
- RMP - Risk Management Plan
- SSTS - Section Seven Tracking System (Pesticides)
- ACRES - Brownfields Properties
Subscribe to:
Posts (Atom)


